Creative Data Visualisation

  • Status: Closed
  • Prize: €20
  • Entries Received: 8
  • Winner: Farrukh Saeed

Contest Brief

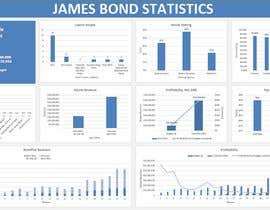
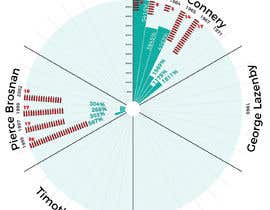
I need a creative data visualisation in infographic style using different kind of graphs, pie charts etc. (depending on what's most applicable for the variables).
The dataset is pretty small containing 22 movies each of which has 8-9 attributes and not all the data needs to be used.
It should satisfy basic rules and guidelines in the state of the art of data visualization and should manage to visually compare the different movies with their attributes easily. The excel sheet with the data is attached. Also, I attached an infographic example for the style that I was looking for and a pdf file explaining the job in detail.
Once the project is awarded it should be done within max. 4 days.

Recommended Skills

Employer Feedback

“Good quality, prompt delivery and very nice communication. Thanks for the enjoyable collaboration. Highly recommend!”

Profile image Mogli58, Germany.

Top entries from this contest

View More Entries

Public Clarification Board

  • Farrukh Saeed
    Farrukh Saeed
    • 4 years ago

    can you please answer the following question.
    1) some of charts/chart designs in sample you attached are not available e.g (step chart it is available in column chart style but not that way as in sample)

    2) How can I add map when no geographical location is available in sheet

    3) there are limited types of charts which are compatible with data. every chart shown in the sample is either not available or not compatible with data attached. how can we achieve within excel

    • 4 years ago
  • Farrukh Saeed
    Farrukh Saeed
    • 4 years ago

    don't close working on it

    • 4 years ago
  • Farrukh Saeed
    Farrukh Saeed
    • 4 years ago

    CH please clear 1 thing. Do you want us to go to the links and fill the data in spreadsheet??? or just want to convert the excel sheet

    • 4 years ago
    1. Mogli58
      Contest Holder
      • 4 years ago

      I need you to use the data from the spreadsheet to create a visualization in the form of an infographic using e.g. pie charts and bar charts, in such a way that it visualizes the different attributes of the different actors and movies.

      • 4 years ago
    2. Farrukh Saeed
      Farrukh Saeed
      • 4 years ago

      got it

      • 4 years ago
  • denysmuzia
    denysmuzia
    • 4 years ago

    Hi! Do you really want to get a good infographic for 20 euros?

    • 4 years ago
    1. Mogli58
      Contest Holder
      • 4 years ago

      it's for a university project, so it doesnt need to be professional ;)

      • 4 years ago
    2. Mogli58
      Contest Holder
      • 4 years ago

      shouldn't be more than an hour of work for someone who is familiar with the software

      • 4 years ago
  • Farrukh Saeed
    Farrukh Saeed
    • 4 years ago

    working on it send you soon

    • 4 years ago
  • udemepaul
    udemepaul
    • 4 years ago

    Let me see the work

    • 4 years ago
    1. Mogli58
      Contest Holder
      • 4 years ago

      i attached the excel sheet

      • 4 years ago

Show more comments

How to get started with contests

  • Post your contest

    Post Your Contest Quick and easy

  • Get tons of entries

    Get Tons of Entries From around the world

  • Award the best entry

    Award the best entry Download the files - Easy!

Post a Contest Now or Join us Today!