
kannasanthosh
India

NOTE: this math/statistical challange requires programming or advanced Excel skills
_______
INTRODUCTION:
As most people know, when a bad news hits a company the stock price of that company falls and the inverse happens if it's a good news.
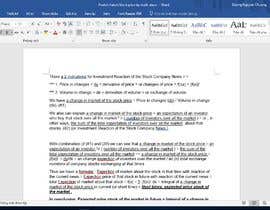
In the attached two images I show you three recent real-world examples of what happened to the stock price and volumes of NVidia and Amazon when bad news hit them.
As you can see there is a sudden increase of traded volume (bars on the bottom) and the price falls because people sell in panic, both things happening for some tens of minutes, allowing an investor able to act immediately (let's say after just 1-2 minutes of seeing the sudden change in volume and price) to earn money for that fall predicting it, with a financial operation called "short selling" (earn while the price falls), closing the position when the fall is over.
Similar thing can be done in the opposite direction when there's a good news: the investor can immediately buy the stock, selling when the rise finishes, earning money for the rise...
_____
REQUEST:
What I ask you is to find the best algorithm for earning the most money by automatically detecting the best moment to start a position ("short sell" or buy) and the best moment to close it, applied to the attached 12MB big file that contains the real price and volumes of the Amazon stock with 1 minute resolution of last 10 years, for your performance tests.
The algorithm that, applied to this data set, virtually earns the most money, wins my award (and you can use it like me for earning money on the stock market of course;)
A very simple example algorithm could be this:
- start a position immediately after there's a sudden 4x increase of volume together with 0.50% change in price ("short sell" if -0.50% or buy if +0.50%)
- close the position 1 hour later or when the price reverts back of half of the total reached change, the sooner
RULES:
- to calculate the earnings of your algorithm, you must start the calculation with a virtual investment of 10.000$ and subtract a virtual (like real world) commission equal to 0.06% price + 10$ fee every time you virtually start and every time you virtually close a position
- the algorithm can use only the data provided by the 12MB file, that are prices and volumes. Its actions must be only based upon prices and volumes (and time).
- you cannot cheat by overfitting code to specific single patterns in the provided data set. The algorithm must make sense as general rule to predict the future cases, though it can be complex
NOTE:
the headers of the 12MB txt file are these:
date time open(first price) highest lowest close(last price) volume


Post Your Contest Quick and easy

Get Tons of Entries From around the world

Award the best entry Download the files - Easy!
